

Coding Intelligence
Optimize Revenue. Reduce Risk.
See What Matters: Clear Insights from Complex Claims Data
SENTRY Analytics transforms claims data into actionable intelligence, identifying provider outliers, coding risk, revenue leakage, and patterns that may trigger denials, audits, or automatic payer down-coding. Whether your priority is protecting margins, strengthening compliance oversight, or ensuring accurate reimbursement, SENTRY delivers clear, data-driven insight to address risk early, recover opportunity, and drive measurable performance improvement without guessing where exposure exists.
Specialty-Focused Accuracy
See how your providers compare to national specialty benchmarks and see exactly where opportunities exist to improve documentation, accuracy, and reimbursements.
Spot Down-Coding Before it Hurts Revenue
Identify when payer behavior or coding patterns suggest downcoding or suppressed reimbursement, giving you the evidence you need to make better decisions.
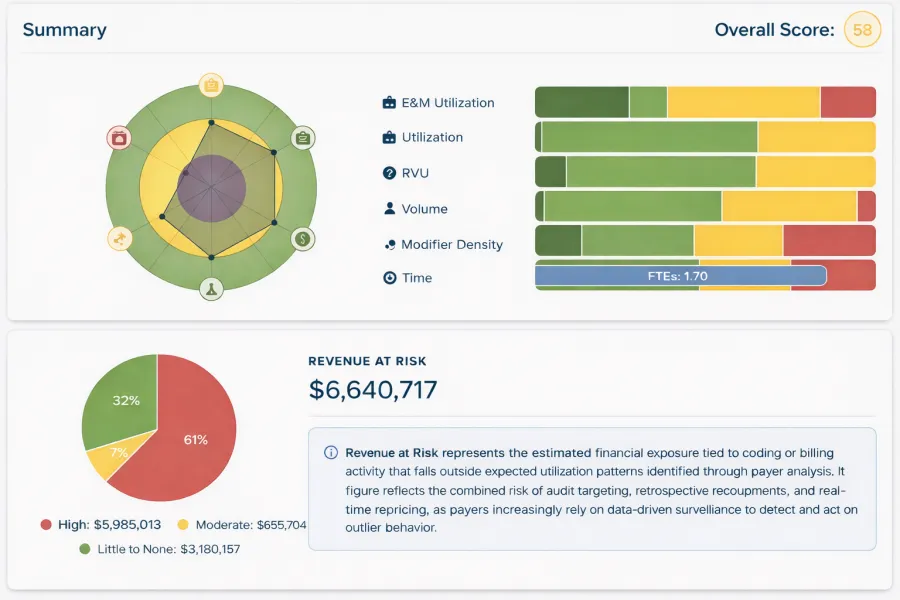
SENTRY Summary Dashboard
– Revenue at Risk & Performance Scoring
Revenue at Risk represents the estimated financial exposure tied to coding or billing activity that falls outside the expected utilization patterns identified through payer analytics. Let Healthcare Compliance Pros use your data to drive surveillance that detects and acts on outlier behavior that puts your revenue at risk!
Quarterly Analytics & Audit Approach
Analytics
Audits
Guidance
Risk analytics are performed across all providers to identify outlier billing patterns and prioritize audit activity. These analytics ensure both existing and emerging risk is continuously monitored.
In the first quarter, audits will be focused on the providers and codes that have the highest risk profile based on the initial analytics data. HCP will establish baseline guidance for the organization in general during the first quarter. In the following quarters, audits and guidance will be focused on the providers and codes that have the highest risk profile to ensure existing and emerging risk is monitored. Every provider will be audited and receive guidance on a quarterly rotation during each year.
Audit priority is established by identifying high risk providers.
Looking for more ways to enhance your compliance strategy?
Discover our additional services